Home > Less Cash in Their Pockets Trends in Incomes, Wages, Taxes, and Health (…)
Less Cash in Their Pockets Trends in Incomes, Wages, Taxes, and Health Spending of Middle-Income Families, 2000-03
by Open-Publishing - Monday 1 November 2004by Lawrence Mishel, Michael Ettlinger, and Elise Gould
The economic well-being of middle-income families has changed significantly over the last few years, largely as a result of three important dynamics. First, the recession that started in March 2001 was followed by an unusually long period-two and a half years-of job losses, despite an increase in output of goods and services. Although employment has grown since September 2003, it has not done so at a sufficient rate to diminish the substantial labor slack generated by the downturn in 2001 (Mishel et al. 2004). Consequently, pre-tax incomes fell for three years in a row, leaving the typical household with $1,535 less income in 2003 than in 2000, a drop of 3.4%. This decline in income was primarily the result of lost work opportunities from fewer family members working and fewer hours worked per worker (fewer weeks per year and fewer hours per week). A second dynamic influencing family economic well-being is the income tax reductions legislated at the federal level, primarily those of 2001 and 2003. It is important to assess the degree to which shifts in taxation have offset the recession-induced income losses. Finally, the health care costs facing families have surged as insurance premiums and out-of-pocket costs have grown rapidly over the past few years (Families USA, September 2004).
This report measures the net effect of these factors on middle-class family incomes. In particular, we estimate the inflation-adjusted change between 2000 and 2003 in three income measures: pre-tax incomes, after-tax incomes, and after-tax and after-health-spending incomes. We do so for three types of families-married couples with children, single mothers, and elderly couples (over age 65)-and for young single persons (age 25-34). For convenience, we refer to these four living arrangements as four "family types." We examine changes for the middle fifth of each family type as a way to identify trends for a "typical" family; whenever we refer to trends in the income of a family type we are referring to the middle fifth of those families. Details about the data employed for this analysis are presented in the Appendix. We find that:
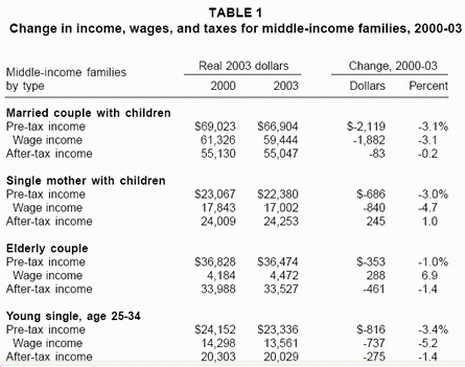
• Pre-tax incomes fell for middle-income families of every type between 2000 and 2003. Driven by a recession-induced fall-off in wage income, pre-tax incomes fell by $2,119, or 3.1%, for married-couple families with children; single mothers lost $686 in pre-tax income, or 3.0%; elderly couples lost $353, or 1.0%; and young singles lost $818, or 3.4%.
• After taking into account changes in both pre-tax income and taxes, the finding remains that most middle-income families lost ground between 2000 and 2003. Incomes declined slightly over this period (by 0.2%) for married couples with children and by 1.4% for elderly couples and young singles. Single-mother families saw after-tax income gains of 1.9% because of the greater refundability of child tax credits.
• Family spending on higher insurance co-pays, deductibles, and premiums has escalated in recent years. Middle-income families saw their incomes erode between 2000 and 2003, after changes in both taxes and health spending are taken into account. For married-couple families with children, health spending rose three times faster than income (not inflation-adjusted) between 2000 and 2003, absorbing half the growth of their income. The post-tax, post-health-spending income of married-couple families with children, for instance, fell $699, or 1.3%, between 2000 and 2003, while that of single-mother families fell $433, or 2.0%.
Changes in income, wages, and taxes
Table 1 presents the inflation-adjusted levels and changes of pre-tax income, wage income, and after-tax income for the 2000-03 period, using the average of families in the middle income fifth for each family type. As shown in the table, pre-tax incomes fell for every family type over this period. Middle-income families with children had incomes roughly 3.0% lower in 2003 than in 2000. For families with children, including both married couples and single mothers, this income erosion was driven by the decline in wage income due to the recession and slack labor market conditions. This is not surprising given that wage income comprises 89% of the income of married couples with children and 78% of single mothers’ income. Young single people also saw an income decline, driven by the 5.2% decline in their wage income. Elderly couples were the only group for which income declines were not a result of falling wages, as they rely less heavily on wage income (about 12% of total income). Elderly couples even saw a rise in their wage income over the 2000-03 period, presumably reflecting the increasing labor force participation of older workers over the last few years. Still, the fall-off in their capital gains, interest, and dividend income led elderly-couple incomes to fall by 1.0% from 2000 to 2003.
In order to capture the role of changes in taxation on family economic well-being, we estimated tax payments to assess trends in the after-tax income of families. The taxes included in our analysis are federal and state income taxes, state and local property taxes, and federal payroll taxes (for Social Security and Medicare). Families paid less federal income tax in 2003 than 2000, with the exception of middle-income single mothers, who had no federal income tax liability in either 2000 or 2003. Single-mother families, however, benefited from the lessening of restrictions for receiving a refundable child tax credit. Elderly couples had a very modest federal income tax liability in 2000, just $44, which was eliminated by 2003.
Note that this fall-off in income tax payments reflects both the legislated change in tax rates and the reduction in income due to the recession. Income tax changes were partially offset by higher taxes at the state and local level (property and state income taxes), which increased for all four of these family types even though incomes fell over this period; state and local taxes grew roughly four times faster than nominal (not inflation-adjusted) income between 2000 and 2003. These state and local tax increases are the result of tax shifts arising from state and local budget-balancing in a weak economy, aggravated by reductions of federal taxation and the shifting of spending responsibilities to state and local governments.
The net effect of the recession-induced decline in incomes and changes in taxation is that middle-income families in every family type except single mothers saw their after-tax incomes reduced between 2000 and 2003. Even with a drop in federal tax payments, married-couple families with children still saw a slight 0.2% decline in real after-tax income, while young singles and elderly couples each lost 1.4%.
Accounting for health care spending
Table 2 presents data on the increase in middle-income family health care costs (direct cash outlays) between 2000 and 2003. As explained in the Data Appendix, there are two dimensions to family health care costs. One is "out-of-pocket expenditures," a category which includes insurance deductibles and co-pays. The other health costs are the contributions made toward the premiums paid for health insurance, such as employee payments for employer-provided health insurance. In order to simplify the analysis, these data assume that each family type has one type of health care coverage (based on what is predominant for that group) and that there is no change in coverage over the 2000-03 period.1

Table 2 shows that health care costs are indeed squeezing families. Out-of-pocket expenditures have grown by 33% for families with employer-based health insurance (married couples with children, single mothers, and singles), and elderly couples relying on Medicare saw a 37% increase. Payments toward employer-provided insurance premiums grew by roughly 50%, while Medicare Part B premium contributions rose by 29%. Family health costs rose 43-45% for married couples with children, single mothers, and young singles. In contrast, family incomes for these groups rose far less-by less than 4%-before any adjustment for inflation. For married couples with children, for instance, health costs escalated $1,125, from $2,630 in 2000 to $3,755 in 2003, while their non-inflation-adjusted incomes only rose by $2,283 (see the Appendix). This suggests that higher health care costs consumed about half the increase in (non-inflation-adjusted) incomes of middle-class married couples with children.
The bottom line
Table 3 presents three different income measures that allow us to assess changes in economic well-being for each family type over the 2000-03 period. Two of these measures have already been presented in Table 1: pre-tax income and after-tax income. The third measure incorporates changes in family health care costs by subtracting these costs from after-tax incomes to derive an after-tax and after-health-spending income.2

As described in the previous section, middle-income families in each family type saw their pre-tax incomes fall behind inflation between 2000 and 2003, ranging from the 3.1% loss for married couples with children to the lesser 1.0% loss for elderly couples. Every group also lost ground in terms of real after-tax income (i.e., the net effect of changes in pre-tax income and taxes at all levels of government), except for single mothers, who benefited from a greater ability to obtain a refundable child tax credit. Incorporating higher family health care costs into our measure of family economic well-being captures the squeeze on families that has been discussed in the media. In fact, income after both taxes and health costs has declined for each family type, including a drop of $699, or 1.3%, for married couples with children and a $433, or 2.0%, fall for single-mother families.
Conclusion
Many changes have occurred over the last few years that have affected family living standards. A recession started in March 2001 and, although it was mild in terms of how much the gross domestic product fell, the recession and weak recovery led to persistent job losses that have left the labor market as weak as it was in late 2001 when the recovery began (Mishel et al. 2004). The good news has been that productivity growth, which facilitates improved living standards, has grown faster in recent years than it has over the prior three decades. Unfortunately, the faster productivity growth has not yielded higher pre-tax incomes for middle-income families because of the erosion of work opportunities over the last few years. Even when we account for the lesser tax payments required of families we find that incomes (after-tax, inflation-adjusted) for most middle-income families were lower in 2003 than in 2000. When we incorporate the higher out-of-pocket health spending and higher premium payments for health insurance, we find that middle-income families in each family type lost ground (in their after-tax and after-health-spending incomes) between 2000 and 2003. These results indicate that middle-income families now have less income available-less "cash in their pockets"-to meet their needs.
Data Appendix
The data relied upon for this analysis are primarily drawn from the Census Bureau’s family income series, the same data widely used to compute trends in poverty and income inequality (these data are known as the March CPS income, or demographic, supplement). The basic data are the Census money income data supplemented by an estimate of capital gains. We calculated tax payments based on the level and composition of income for each family type. Health care costs were estimated based on the Medical Expenditure Survey data for 2000 and extrapolated forward based on survey data. The data are displayed in nominal terms in Table A1. Further details are presented below.

Income Trends
The family income data are based on the Census Bureau’s March Current Population Survey (CPS) supplement. This survey allows us to compute the total income of various types of families and the components (wage income, dividend income, etc.) needed to estimate tax payments. Our basic measure of income is the Census "money income" measure, which includes wage and salary, self-employment, pension, interest, rent, dividend, government cash assistance and other money income. We added an estimate of realized capital gains to allow for a more complete income measure and to enable us to capture changes in tax payments related to capital gains. We employed the Census Bureau’s estimate of capital gains (used for their computations of alternative definitions of income) for 2000. We obtained a 2003 value of capital gains, which is not yet available from the Census Bureau, by extrapolating forward the 2002 values based on the 7% increase that the Congressional Budget Office has estimated for capital gains growth from 2002 to 2003.
Tax Calculations
For each family type, the tax payments are estimated based on the average incomes and components of income (capital gains, wages, etc.) for the middle fifth of families of that type (married couples with children, etc.). The following describes the method for each tax for which we estimated the payment:
Federal Personal Income Tax
The federal income tax calculation used averages for the middle fifth calculated from the CPS. Income and income components where taxation is dependent on component type were taken from the CPS. Number of children was also taken from the CPS. Adjustments, deductions, and credits were derived using IRS tabular data for income levels and, where available, family types. Deductions were weighted by the share of itemizers and non-itemizers. Using these data for each family type, a straightforward tax form calculation was made of tax liability for tax (calendar) years 2000 and 2003.
FICA/HI Tax
Appropriate rates were applied to the average wage and self-employment income from the CPS.
State Income Tax
2000 state personal income tax levels were derived from the Institute for Taxation and Economic Policy tax model. Personal income tax levels for 2003 were calculated by multiplying the 2000 levels by the increase in per-capita state personal income taxes over the period.
State and Local Property Tax
Property tax calculations used IRS and CPS data and were verified against the Institute on Taxation and Economic Policy tax model. Property taxes for those that itemize were interpolated using IRS data by income level and family type for 2000. These were calculated for 2003 by the average change in reported property taxes between those years. CPS property taxes are available for 2000 and 2002, but not 2003. "CPS" property taxes for 2003 were calculated using 2002 property taxes adjusted to 2003 by per-capita change in property taxes. For each year’s property taxes, IRS and CPS property taxes were weighted for each family type according the share of itemizers for the income level. This method was employed because the CPS understates property taxes paid. This method allows for the use of IRS data to the extent such is available, i.e., for itemizers. The results were compared to results from the Institute on Taxation and Economic Policy where such comparisons were possible.
Health Care Spending
To estimate health care spending for particular family types we selected a representative if not predominant insurance type. Our representative married family with children profile has all members on an employer-provided health plan. According to the Medical Expenditure Panel Survey (MEPS), 62% of married families with children have employer-provided health insurance for all family members. Eighty-three percent have at least one member with employer-provided insurance. Our profile for single mothers was more difficult to pick as there is not a predominant or typical insurance arrangement. Some have employer-provided health insurance, others have Medicaid or State Children’s Health Insurance Program (SCHIP), some have a combination, and others are uninsured. Therefore, even though only 23% of single-mother families have all members covered by an employer health plan, we chose the type where the entire family is on employer-sponsored insurance.
While nearly all individuals over age 65 are covered by Medicare, only 35% of elderly couples were covered by only public insurance. Others have some combination of public and private for one or both members in the couple. For simplicity, we chose a family with only Medicare or a combination of Medicare and Medicaid. The vast majority of young single people have private insurance either though an employer or through direct purchase. About 70% of single people age 25 to 34 were covered by employer provided health insurance. Therefore, we chose this as our single-person prototype.
Although there has been a noted decline in insurance coverage from 2000 to 2003 across all family profiles, we assume that health insurance status in 2003 was the same as in 2000. This decision allows us to avoid any assessment of the cash value of insurance. Our prototypical families were lucky enough to keep insurance throughout the entire period.
Out-of-pocket expenditures are estimated for 2000 using the MEPS. Families for each type are lined up by family income. The 40th to 60th percentile of families is selected and the average out-of-pocket expenditures are calculated for those families who fit into the designated insurance profile (e.g., all with employer-provided insurance).
While micro data is available for data year 2000, no such detailed information is available for 2003 from the MEPS. Therefore, we apply a 33% increase between 2000 and 2003 to those under age 65 and an increase of 37% to those over age 65 as projected by the Agency for Health Care Research and Quality.3 While these are average projections for out-of-pocket expenditures by age only, we believe they provide a reasonable approximation for out-of-pocket expenditures for 2003. These are projections for how much consumers in typical families will be paying out of their own pocket. They are not based on medical care inflation, which assumes families consume a particular set basket of medical goods and services.
Premiums are determined in two ways. Employer-provided health insurance premiums for both individuals and families are located in the Kaiser Family Foundation Employer Health Benefits Report.4 We take the average premiums and apply them to our family or individual prototypes. For over-65 couples, we use Medicare Part B premiums in 2000 and 2003 as reported by the Center for Medicaid and Medicare Services.5
Inflation-adjustment
We convert pre-tax income and after-tax incomes into 2003 dollars using the Consumer Price Index for all items. We deflate the after-tax and health-spending income with the CPI index that excludes medical care so that we avoid double counting changes in health costs.
Endnotes
1. There has been an erosion of health insurance coverage over this time period. Incorporating this trend in our analysis of family health care spending requires estimates of the cost of losing or not having insurance, which are not readily available. We believe that incorporating the costs of losing health insurance coverage would yield even greater increases in health costs than we have estimated.
2. We deflate the resulting nominal incomes with a price index that excludes medical care to avoid double-counting any increase in out-of-pocket health care, as described in the appendix.
3. These projections can be found at: < http://www.meps.ahrq.gov>.
4. Premium information from the Kaiser Employer Health Benefits Study can be found at < http://www.kff.org>.
5. Current and past Medicare Part B premiums can be found on the Web site for the Center for Medicaid and Medicare Services: < http://www.cms.gov>.
Bibliography
M ishel, Lawrence, Jared Bernstein, and Sylvia Allegretto. 2004. The State of Working America 2004/2005. An Economic Policy Institute series. Ithica, N.Y.: Cornell University Press.
Families USA. 2004. "Health care: Are you better off today than you were four years ago?" Families USA, Publication No. C4-04-100. Washington, D.C. (September).